| Automated charting and reporting |
SharpPlot Tutorials
General Tutorials
Chart Samples
Style Examples
SharpLeaf Tutorials
Document Layout Tutorials
Text Flow Tutorials
Table Tutorials
Visual Glossaries
SharpPlot Class
SharpPlot Properties
SharpPlot Structures
SharpPlot Enumerations
PageMap Class
SharpLeaf Reference
SharpLeaf Class
SharpLeaf Properties
SharpLeaf Methods
Table Class
Table Properties
Table Methods
SharpLeaf Structures
FontType Structure
ParagraphStyle Structure
BoxStyle Structure
SharpLeaf Enumerations
DocumentLayout Classes
DocumentLayout Class
PageLayout Class
PageElement Abstract Class
Frame : PageElement Class
TextBlock : PageElement Class
ImageBlock : PageElement Class
Box : PageElement Class
Rule : PageElement Class
Common Reference
Document Class
VectorMath Class
DbUtil Class
Download
Release Notes
Licensing
SharpPlot Reference > SharpPlot Methods > DrawCloudChart Method
SharpPlot.DrawCloudChart Method
Draw 3D grid and construct 3D Scatter from x,y and z values.
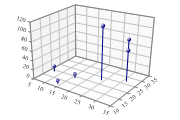
Example
sp = new SharpPlot(180,120);
sp.SetMargins(0,12,18,4);
sp.SetMarkers(Marker.Bullet);
ydata = new int[] {19,27,31,12,19,23};
xdata = new int[] {7,31,29,14,16,24};
zdata = new int[] {12,65,77,7,9,112};
sp.CloudChartStyle = CloudChartStyles.WallShading|CloudChartStyles.GridLines|
         CloudChartStyles.Risers;
sp.SetMarkers(Marker.Ball);
sp.Perspective = 6;
sp.SetAxisStyle(Color.Gray,LineStyle.Solid,0.5);
sp.DrawCloudChart(xdata,ydata,zdata);
The short tutorial shows a few of the possibilities and some sample code.
Overloads
- public void DrawCloudChart(int[] xValues,int[] yValues,int[] zValues);
- public void DrawCloudChart(string[] xCategories,int[] yValues,int[] zValues);
- public void DrawCloudChart(int[] xValues,string[] yCategories,int[] zValues);
- public void DrawCloudChart(double[] xValues,double[] yValues,double[] zValues);
- public void DrawCloudChart(string[] xCategories,int[] yValues,double[] zValues);
- public void DrawCloudChart(int[] xValues,string[] yCategories,double[] zValues);
- public void DrawCloudChart(string[] xCategories,string[] yCategories,int[] zValues);
- public void DrawCloudChart(string[] xCategories,string[] yCategories,double[] zValues);
- public void DrawCloudChart(int[] xValues,int[] yValues,double[][] zValues);
- public void DrawCloudChart(double[] xValues,double[] yValues,double[][] zValues);
Description
The Cloud chart is essentially a scatter-plot in 3 dimensions (maybe you are running an experiment in which you vary pressure and temperature, and are interested in the yield of the result). Rather than fitting a line to show the relationship between input and output, you fit a plane (if the data is linear in both x and y) or a curved surface. The markers are often located in XY-space by drawing risers from the ‘paper’ – this makes it much easier to visualise where they are positioned.
In fact, the Cloudchart is much more versatile than this, as it can also be drawn with lines connecting the points, or planes shaded down to the XY plane (the Z-value is always assumed to be drawn vertically). The Tutorial gives several more examples, and of course multiple charts may be combined using a common set of axes to make quite complex diagrams in 3 dimensions.
See also ...
Cloud charts for discrete XYZ data with perspective | SharpPlot Members | SharpPlot.CloudChartStyle Property