| Automated charting and reporting |
General Tutorials
Chart Samples
SharpLeaf Tutorials
Document Layout Tutorials
Text Flow Tutorials
Table Tutorials
Visual Glossaries
SharpPlot Reference
SharpPlot Class
SharpPlot Properties
SharpPlot Methods
SharpPlot Structures
SharpPlot Enumerations
PageMap Class
SharpLeaf Reference
SharpLeaf Class
SharpLeaf Properties
SharpLeaf Methods
Table Class
Table Properties
Table Methods
SharpLeaf Structures
FontType Structure
ParagraphStyle Structure
BoxStyle Structure
SharpLeaf Enumerations
DocumentLayout Classes
DocumentLayout Class
PageLayout Class
PageElement Abstract Class
Frame : PageElement Class
TextBlock : PageElement Class
ImageBlock : PageElement Class
Box : PageElement Class
Rule : PageElement Class
Common Reference
Document Class
VectorMath Class
DbUtil Class
Download
Release Notes
Licensing
SharpPlot Tutorials > Style Examples > Exact fit of Axis Range
Exact fit of Axis Range
By default SharpPlot rounds the scale to a major tickmark interval in both directions. If these ticks are well spaced out (for example annual data with 11 minor ticks at the month boundaries) it is often better just to span the range of the data.
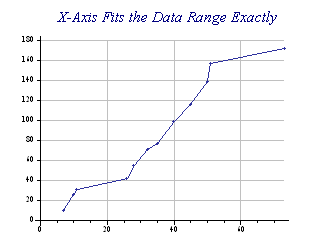
sp.SetXTickMarks(20,3);
sp.Heading = "X-Axis Fits the Data Range Exactly";
sp.XAxisStyle = XAxisStyles.ForceZero|XAxisStyles.ExactFit;
sp.DrawLineGraph(col_S1,col_S2);
This style is often coupled with ForceZero to make the lower value round back nicely.
See also ...
SharpPlot.XAxisStyle Property | SharpPlot.YAxisStyle Property | SharpPlot.ZAxisStyle Property