| Automated charting and reporting |
General Tutorials
Style Examples
SharpLeaf Tutorials
Document Layout Tutorials
Text Flow Tutorials
Table Tutorials
Visual Glossaries
SharpPlot Reference
SharpPlot Class
SharpPlot Properties
SharpPlot Methods
SharpPlot Structures
SharpPlot Enumerations
PageMap Class
SharpLeaf Reference
SharpLeaf Class
SharpLeaf Properties
SharpLeaf Methods
Table Class
Table Properties
Table Methods
SharpLeaf Structures
FontType Structure
ParagraphStyle Structure
BoxStyle Structure
SharpLeaf Enumerations
DocumentLayout Classes
DocumentLayout Class
PageLayout Class
PageElement Abstract Class
Frame : PageElement Class
TextBlock : PageElement Class
ImageBlock : PageElement Class
Box : PageElement Class
Rule : PageElement Class
Common Reference
Document Class
VectorMath Class
DbUtil Class
Download
Release Notes
Licensing
SharpPlot Tutorials > Chart Samples > Tabulating data
Tabulating data
SharpPlot can tabulate as well as chart, but please be aware that these tables are not designed to display large amounts of complex data. They are for summaries and simple CrossTabs where a limited amount of data can be used to augment a complex chart. The examples show a table used as a chart in its own right, and some simple summaries and groupings added as ‘notes’ to typical timeseries data.
A Simple Data Table
SharpPlot treats each array-element in the argument as a column of data, and uses the X-labels as the column headers, with the Y-labels as the row-stubs. The Y-caption is used here to label the cell in the top-left corner. Note that the cell font is set by SharpPlot.SetValueFont.
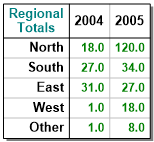
column1 = new int[] {18,27,31,1,1};
column2 = new int[] {120,34,27,18,8};

sp.SetYLabels(new string[]{"North","South","East","West","Other"});
sp.SetXLabels(new string[]{"2004","2005"});

sp.YCaption = "Regional\nTotals";

sp.TableStyle = TableStyles.Boxed|TableStyles.GridLines|TableStyles.Shadowed;
sp.SetValueFont("ARB",12);
sp.ValueTagFormat = "##0.0";
sp.SetLabelFont("ARB",13);
sp.SetCaptionFont("ARB",13);

sp.DrawTable(new int[][]{column1,column2});
If a simple array of numbers is passed, it is treated as a one-column table.
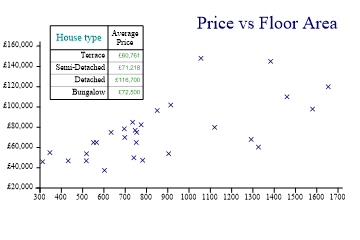
Average Price by House Type
This example adds a table of average prices to the house-price data used in the ScatterPlot tutorials. Another good use of a summary table would be to show the ‘count’ as a table to allow a quick check on the number of houses in each sample.
price = new int[] {60500,47500,46000,110000,148000,65000,79950,54000,120000,85000,
         65000,55000,70000,82500,78500,49950,46950,46950,77000,102000,37500,68000,
         65000,145000,98000,75000,96500,53950,75000};
area = new int[] {1326,782,312,1460,1056,752,1120,904,1654,735,565,346,698,775,696,
         741,432,517,747,914,603,1292,551,1383,1580,754,850,518,634};
housetype = new int[] {1,2,2,3,3,2,1,1,2,4,4,1,2,2,3,2,1,1,2,3,1,1,4,3,1,2,2,2,4};

sp.Heading = "Price vs Floor Area";
sp.HeadingStyle = HeadingStyles.Right;
sp.YLabelFormat = "£##,###,##0";

sp.DrawScatterPlot(price,area);

sp.GroupBy(housetype,new string[]{"Terrace","Semi-Detached","Detached","Bungalow"},
         GroupByFunction.Average);
sp.SetXLabels("Average\nPrice");
sp.YCaption = "House type";

sp.TableStyle = TableStyles.Boxed|TableStyles.GridLines|TableStyles.Opaque;
sp.YLabelFormat = "";  // otherwise would format groupby labels
sp.ValueTagFormat = "£##,###,##0";

sp.SetTablePosition(350,180000);
sp.DrawTable(price);
Note that the table is placed using the axis co-ordinates here. It can also be placed with absolute co-ordinates (given in points) and the table-width may be given as an optional 3rd argument to scale the table to fit the available space.
Creating a CrossTab from the Barley Data
The barley yield data is a good candidate for a Cross-tab. The two methods that do this are GroupBy (to collect data into the rows) and SplitBy to spread the values across the columns.
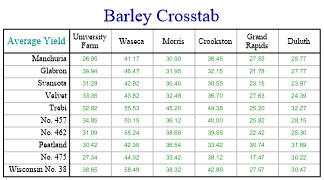
sp.Heading = "Barley Crosstab";

sp.SplitBy(barleyfarm);
sp.GroupBy(barleyvariety,GroupByFunction.Average);

sp.TableStyle = TableStyles.GridLines;
sp.XLabelFormat = "xxxxxxxxx;";

sp.YCaption = "Average Yield";

sp.ValueTagFormat = "##0.00";
sp.ValueTagStyle = ValueTagStyles.Center;

sp.DrawTable(barleyyield);
Here it has been summarised by Variety and categorised by Year as a 2-way table. You can summarize or split by up to 2 levels here to create more complex tabulations.
Cross-tabulation with Two Levels
This example shows the same data, but split 2 ways to make a heirarchical summary. Note that a frame has already been drawn here (with the main chart heading) and the table is fitted automatically into the frame width.
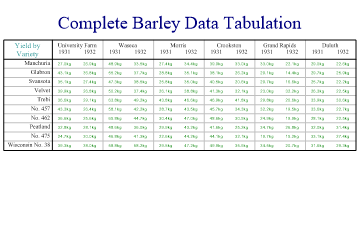
sp.Heading = "Complete Barley Data Tabulation";
sp.SetMargins(36,0,0,0);
sp.DrawFrame();

sp.SplitBy(barleyfarm);
sp.SplitBy(barleyyear);
sp.GroupBy(barleyvariety);

sp.TableStyle = TableStyles.GridLines|TableStyles.Spanned|TableStyles.FitWidth;
sp.YCaption = "Yield by\nVariety";
sp.ValueTagFormat = "##0.0kg";  // Formatter
sp.ValueTagStyle = ValueTagStyles.Center;

sp.DrawTable(barleyyield);
You can also add an extra level of Grouping to have an indented 2-level summary shown in the row-stubs.
Summary
Tables may be used on their own to provide summary information, or in combination with other charts as structured notes.