| Automated charting and reporting |
SharpPlot Tutorials
General Tutorials
Chart Samples
Style Examples
SharpLeaf Tutorials
Document Layout Tutorials
Text Flow Tutorials
Table Tutorials
Visual Glossaries
SharpPlot Class
SharpPlot Properties
SharpPlot Structures
SharpPlot Enumerations
PageMap Class
SharpLeaf Reference
SharpLeaf Class
SharpLeaf Properties
SharpLeaf Methods
Table Class
Table Properties
Table Methods
SharpLeaf Structures
FontType Structure
ParagraphStyle Structure
BoxStyle Structure
SharpLeaf Enumerations
DocumentLayout Classes
DocumentLayout Class
PageLayout Class
PageElement Abstract Class
Frame : PageElement Class
TextBlock : PageElement Class
ImageBlock : PageElement Class
Box : PageElement Class
Rule : PageElement Class
Common Reference
Document Class
VectorMath Class
DbUtil Class
Download
Release Notes
Licensing
SharpPlot Reference > SharpPlot Methods > DrawVectors Method
SharpPlot.DrawVectors Method
Create a vector diagram (showing a directed graph, or current flows):
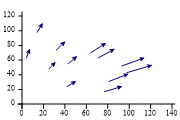
Example
sp = new SharpPlot(180,120);
sp.SetMargins(12,12,18,4);
x1 = new int[] {77,25,43,42,93,32,81,14,64,4,71,98};
y1 = new int[] {17,48,55,24,52,74,31,98,70,63,63,43};
x2 = new int[] {93,31,51,50,114,40,99,19,78,7,86,121};
y2 = new int[] {24,57,65,31,63,85,41,110,83,75,75,53};
sp.VectorStyle = VectorStyles.ArrowLines;
sp.DrawVectors(x1,y1,x2,y2);
The short tutorial shows a few of the possibilities and some sample code.
Overloads
- public void DrawVectors(int[,] data);
- public void DrawVectors(int[] x1,int[] y1,int[] x2,int[] y2);
- public void DrawVectors(double[] x1,double[] y1,double[] x2,double[] y2);
- public void DrawVectors(int[][] data);
- public void DrawVectors(double[][] data);
- public void DrawVectors(double[,] data);
Description
This method takes a matrix (or regular array) of xyxy pairs and draws a set of lines connecting each pair of points. The lines can be marked on the ‘target’ end with arrows, or marked at the root/target ends with the current marker.
Two good uses of this chart type are for drawing any style of directed graph (typically a PERT chart or assembly diagram), or representing a vector field, such as current flows or wind speeds on a map. Value Tags are written along the lines, and are always centered. They may contain multiple lines of text.
See also ...
Vector fields and directed graphs | SharpPlot Members | SharpPlot.DataStyle Property | SharpPlot.VectorStyle Property