| Automated charting and reporting |
SharpPlot Tutorials
General Tutorials
Chart Samples
Style Examples
SharpLeaf Tutorials
Document Layout Tutorials
Text Flow Tutorials
Table Tutorials
Visual Glossaries
SharpPlot Class
SharpPlot Properties
SharpPlot Structures
SharpPlot Enumerations
PageMap Class
SharpLeaf Reference
SharpLeaf Class
SharpLeaf Properties
SharpLeaf Methods
Table Class
Table Properties
Table Methods
SharpLeaf Structures
FontType Structure
ParagraphStyle Structure
BoxStyle Structure
SharpLeaf Enumerations
DocumentLayout Classes
DocumentLayout Class
PageLayout Class
PageElement Abstract Class
Frame : PageElement Class
TextBlock : PageElement Class
ImageBlock : PageElement Class
Box : PageElement Class
Rule : PageElement Class
Common Reference
Document Class
VectorMath Class
DbUtil Class
Download
Release Notes
Licensing
SharpPlot Reference > SharpPlot Methods > DrawPolygon Method
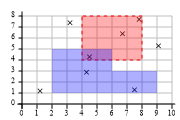
SharpPlot.DrawPolygon Method
Draw polygon from x and y coordinates, with optional Color, edge width, and FillStyle.
Example
sp = new SharpPlot(180,120);
sp.SetMargins(12,12,18,4);
sp.ScatterPlotStyle = (ScatterPlotStyles.GridLines|ScatterPlotStyles.ForceZero);
sp.SetColors(Color.Black);
sp.SetPenWidths(1);
sp.DrawScatterPlot(new double[]{1.2,5.3,2.9,7.4,1.3,4.3,6.4,7.7},new double[]{1.2,
         9.1,4.3,3.2,7.5,4.5,6.7,7.8});
sp.DrawPolygon(new double[] {4,8,8,4,4},new double[] {4,4,8,8,4},Color.Red,
         FillStyle.Opacity30,(double)1,LineStyle.Dash);
sp.DrawPolygon(new double[] {2,9,9,6,6,2,2},new double[] {1,1,3,3,5,5,1},Color.Blue,
         FillStyle.Opacity30,(double)0,LineStyle.Invisible);
Description
If the polygon is drawn before any chart, the co-ordinates used are points, measured from the top left corner of the paper.
If the polygon is drawn after a chart, the chart axes are used as the co-ordinate system for polygon points.
Overloads
- public void DrawPolygon(double[] xValues,double[] yValues);
- public void DrawPolygon(double[] xValues,double[] yValues,Color polyColor);
- public void DrawPolygon(double[] xValues,double[] yValues,double edgeWidth);
- public void DrawPolygon(double[] xValues,double[] yValues,FillStyle polyFill);
- public void DrawPolygon(double[] xValues,double[] yValues,Color polyColor,double edgeWidth);
- public void DrawPolygon(double[] xValues,double[] yValues,Color polyColor,FillStyle polyFill);
- public void DrawPolygon(double[] xValues,double[] yValues,FillStyle polyFill,double edgeWidth);
- public void DrawPolygon(double[] xValues,double[] yValues,double edgeWidth,LineStyle edgeStyle);
- public void DrawPolygon(double[] xValues,double[] yValues,Color polyColor,FillStyle polyFill,double edgeWidth);
- public void DrawPolygon(double[] xValues,double[] yValues,Color polyColor,FillStyle polyFill,double edgeWidth,LineStyle edgeStyle);