| Automated charting and reporting |
SharpPlot Tutorials
General Tutorials
Chart Samples
Style Examples
SharpLeaf Tutorials
Document Layout Tutorials
Text Flow Tutorials
Table Tutorials
Visual Glossaries
SharpPlot Class
SharpPlot Properties
SharpPlot Structures
SharpPlot Enumerations
PageMap Class
SharpLeaf Reference
SharpLeaf Class
SharpLeaf Properties
SharpLeaf Methods
Table Class
Table Properties
Table Methods
SharpLeaf Structures
FontType Structure
ParagraphStyle Structure
BoxStyle Structure
SharpLeaf Enumerations
DocumentLayout Classes
DocumentLayout Class
PageLayout Class
PageElement Abstract Class
Frame : PageElement Class
TextBlock : PageElement Class
ImageBlock : PageElement Class
Box : PageElement Class
Rule : PageElement Class
Common Reference
Document Class
VectorMath Class
DbUtil Class
Download
Release Notes
Licensing
SharpPlot Reference > SharpPlot Methods > DrawPolarChart Method
SharpPlot.DrawPolarChart Method
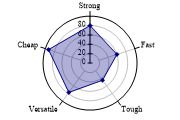
Construct polar or radar chart from data (radial=Y, angular=X).
Example
sp = new SharpPlot(180,120);
sp.SetMargins(12,6,0,0);
sp.PolarChartStyle = PolarChartStyles.Markers|PolarChartStyles.SurfaceShading|
         PolarChartStyles.GridLines|PolarChartStyles.HollowCenter;
sp.SetYRange(0,100);
sp.SetFillStyles(FillStyle.Opacity30);
sp.SetMarkers(Marker.Lozenge);
sp.SetXLabels(new string[]{"Strong","Fast","Tough","Versatile","Cheap"});
sp.DrawPolarChart(new int[] {80,60,45,77,93});
The short tutorial shows a few of the possibilities and some sample code.
Overloads
- public void DrawPolarChart(int[] data);
- public void DrawPolarChart(double[] data);
- public void DrawPolarChart(int[][] data);
- public void DrawPolarChart(double[][] data);
- public void DrawPolarChart(int[] data,int[] xValues);
- public void DrawPolarChart(double[] data,int[] xValues);
- public void DrawPolarChart(int[] data,double[] xValues);
- public void DrawPolarChart(double[] data,double[] xValues);
- public void DrawPolarChart(int[][] data,int[] xValues);
- public void DrawPolarChart(double[][] data,int[] xValues);
- public void DrawPolarChart(int[][] data,double[] xValues);
- public void DrawPolarChart(double[][] data,double[] xValues);
Description
The Polar chart (also known as the Radar chart) may be used in several ways to handle cyclic timeseries or comparisons on many dimensions. If it is called with a simple list of numbers, it treats each value as a logical axis and simply plots the values out as a star shape with as many points as there were values. This can be used very effectively to compare items on different criteria, for example several digital cameras might be compared on (price,zoom,resolution,color fidelity, memory size) each rated from 0 to 10 on an arbitrary scale.
Polar charts are also used as circular lineplots, typically for daily or annual timeseries where it makes sense to plot the values around a circle. They can also be used to represent genuinely directional data, such as a plot of wind-directions recorded over a month, or current flows at various locations on a map.
See also ...
Polar and Radar charts | SharpPlot Members | SharpPlot.PolarChartStyle Property