| Automated charting and reporting |
SharpPlot Tutorials
General Tutorials
Chart Samples
Style Examples
SharpLeaf Tutorials
Document Layout Tutorials
Text Flow Tutorials
Table Tutorials
Visual Glossaries
SharpPlot Class
SharpPlot Properties
SharpPlot Structures
SharpPlot Enumerations
PageMap Class
SharpLeaf Reference
SharpLeaf Class
SharpLeaf Properties
SharpLeaf Methods
Table Class
Table Properties
Table Methods
SharpLeaf Structures
FontType Structure
ParagraphStyle Structure
BoxStyle Structure
SharpLeaf Enumerations
DocumentLayout Classes
DocumentLayout Class
PageLayout Class
PageElement Abstract Class
Frame : PageElement Class
TextBlock : PageElement Class
ImageBlock : PageElement Class
Box : PageElement Class
Rule : PageElement Class
Common Reference
Document Class
VectorMath Class
DbUtil Class
Download
Release Notes
Licensing
SharpPlot Reference > SharpPlot Methods > DrawBoxPlot Method
SharpPlot.DrawBoxPlot Method
Construct box-whisker plot from data and zero, one or two optional categories. The categories may be integer or string arrays (in any combination) or they may both be boolean arrays. The data may be an integer or double array.
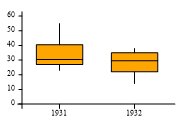
Boxplots may be drawn vertically (the default) or horizontally. The short tutorial shows a few of the possibilities with a classic dataset from the 1930s.
Example
sp = new SharpPlot(180,120);
sp.SetMargins(12,12,18,4);
years = new int[] {1931,1931,1931,1931,1931,1931,1931,1931,1931,1931,1931,1931,1931,
         1931,1931,1931,1931,1931,1931,1931,1931,1931,1931,1931,1932,1932,1932,1932,
         1932,1932,1932,1932,1932,1932,1932,1932,1932,1932,1932,1932,1932,1932,1932,
         1932,1932,1932,1932,1932};
yield = new int[] {27,48,27,39,32,28,43,55,28,38,29,29,35,47,25,40,29,25,39,50,26,
         41,23,26,26,33,34,32,22,22,36,37,35,26,14,25,27,38,35,20,16,22,26,37,38,32,
         32,22};
sp.SetColors(Color.Orange);
sp.YAxisStyle = YAxisStyles.ForceZero;
sp.DrawBoxPlot(yield,years);
Overloads
- public void DrawBoxPlot(int[] data);
- public void DrawBoxPlot(double[] data);
- public void DrawBoxPlot(int[][] data);
- public void DrawBoxPlot(double[][] data);
- public void DrawBoxPlot(int[] data,int[] cat1);
- public void DrawBoxPlot(int[] data,bool[] cat1);
- public void DrawBoxPlot(double[] data,int[] cat1);
- public void DrawBoxPlot(int[] data,string[] cat1);
- public void DrawBoxPlot(double[] data,bool[] cat1);
- public void DrawBoxPlot(double[] data,string[] cat1);
- public void DrawBoxPlot(int[] data,int[] cat1,int[] cat2);
- public void DrawBoxPlot(int[] data,bool[] cat1,bool[] cat2);
- public void DrawBoxPlot(double[] data,int[] cat1,int[] cat2);
- public void DrawBoxPlot(int[] data,string[] cat1,int[] cat2);
- public void DrawBoxPlot(int[] data,int[] cat1,string[] cat2);
- public void DrawBoxPlot(double[] data,bool[] cat1,bool[] cat2);
- public void DrawBoxPlot(double[] data,string[] cat1,int[] cat2);
- public void DrawBoxPlot(double[] data,int[] cat1,string[] cat2);
- public void DrawBoxPlot(int[] data,string[] cat1,string[] cat2);
- public void DrawBoxPlot(double[] data,string[] cat1,string[] cat2);
Description
Tukey’s Box-and-Whisker design is often the best way to approach a large dataset when it is not clear what the significant relationships are. The ‘box’ shows the span of the data between the lower and upper quartiles, with a bar drawn at the median value. The ‘Whiskers’ show the total span of the data – you can use the ‘Deciles’ style to have a dotted line drawn from the 10% and 90% points out to the extremes to reduce the visual impact of outliers.
See also ...
Box-and-Whisker plots for multivariate data | SharpPlot Members | SharpPlot.BoxPlotStyle Property