| Automated charting and reporting |
General Tutorials
Chart Samples
SharpLeaf Tutorials
Document Layout Tutorials
Text Flow Tutorials
Table Tutorials
Visual Glossaries
SharpPlot Reference
SharpPlot Class
SharpPlot Properties
SharpPlot Methods
SharpPlot Structures
SharpPlot Enumerations
PageMap Class
SharpLeaf Reference
SharpLeaf Class
SharpLeaf Properties
SharpLeaf Methods
Table Class
Table Properties
Table Methods
SharpLeaf Structures
FontType Structure
ParagraphStyle Structure
BoxStyle Structure
SharpLeaf Enumerations
DocumentLayout Classes
DocumentLayout Class
PageLayout Class
PageElement Abstract Class
Frame : PageElement Class
TextBlock : PageElement Class
ImageBlock : PageElement Class
Box : PageElement Class
Rule : PageElement Class
Common Reference
Document Class
VectorMath Class
DbUtil Class
Download
Release Notes
Licensing
SharpPlot Tutorials > Style Examples > Model fit
Model fit
A simple regression model is fitted to the data.
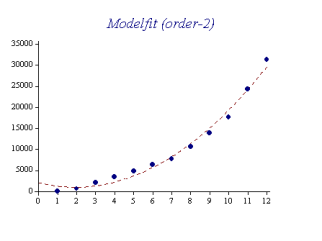
sp.LineGraphStyle = LineGraphStyles.ModelFit;
The default is a linear ‘straight-line’ fit but you can use the Order of Fit setting to fit models up to quartics. The line may be annotated with the regression coefficients. The ‘zeroth’ coefficient is the intercept value, and there will be as many further coefficients as the order of fit.
The model line consumes one line colour, style, width, and key in the cycles, in the order (data, trend, model).
Fitting 3D data
If the modelfit style is used with the cloud chart, the fit is made against both X and Y axes, and the order of fit may be set independently for either.
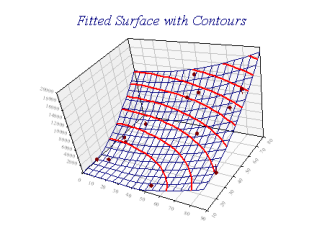
Here, the model is quadratic in both X and Y. Contour lines are shown, and risers have been used to show the residual values in the Z-direction.
See also ...
Annotate Model fit | Growth curve | SharpPlot Members | SharpPlot.CloudChartStyle Property | SharpPlot.LineGraphStyle Property | SharpPlot.ScatterPlotStyle Property | SharpPlot.GetCoefficients Method | SharpPlot.GetFittedValues Method | SharpPlot.GetResiduals Method | SharpPlot.SetModelSpan Method