| Automated charting and reporting |
General Tutorials
Chart Samples
SharpLeaf Tutorials
Document Layout Tutorials
Text Flow Tutorials
Table Tutorials
Visual Glossaries
SharpPlot Reference
SharpPlot Class
SharpPlot Properties
SharpPlot Methods
SharpPlot Structures
SharpPlot Enumerations
PageMap Class
SharpLeaf Reference
SharpLeaf Class
SharpLeaf Properties
SharpLeaf Methods
Table Class
Table Properties
Table Methods
SharpLeaf Structures
FontType Structure
ParagraphStyle Structure
BoxStyle Structure
SharpLeaf Enumerations
DocumentLayout Classes
DocumentLayout Class
PageLayout Class
PageElement Abstract Class
Frame : PageElement Class
TextBlock : PageElement Class
ImageBlock : PageElement Class
Box : PageElement Class
Rule : PageElement Class
Common Reference
Document Class
VectorMath Class
DbUtil Class
Download
Release Notes
Licensing
SharpPlot Tutorials > Style Examples > Indexed data
Indexed data
Data is indexed to the initial value = 100.
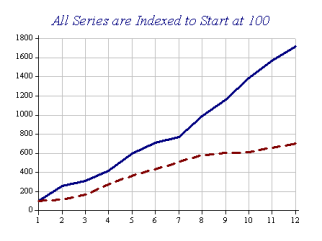
sp.LineGraphStyle = LineGraphStyles.Indexed;
The charted data is 100 times the ratio to the first series value.
This is often used to compare series such as currencies or share prices.
Setting YAxisStyle set to YAxisStyles.LogScale is probably appropriate when using this.
See also ...
SharpPlot Members | SharpPlot.BarChartStyle Property | SharpPlot.CloudChartStyle Property | SharpPlot.LineGraphStyle Property | SharpPlot.MinMaxChartStyle Property | SharpPlot.PolarChartStyle Property | SharpPlot.StepChartStyle Property | SharpPlot.TowerChartStyle Property | SharpPlot.XBarChartStyle Property