| Automated charting and reporting |
SharpPlot Tutorials
General Tutorials
Chart Samples
Style Examples
SharpLeaf Tutorials
Document Layout Tutorials
Text Flow Tutorials
Table Tutorials
Visual Glossaries
SharpPlot Reference
SharpPlot Class
SharpPlot Properties
SharpPlot Methods
SharpPlot Structures
SharpPlot Enumerations
PageMap Class
SharpLeaf Reference
SharpLeaf Class
SharpLeaf Properties
SharpLeaf Methods
Table Class
Table Properties
Table Methods
SharpLeaf Structures
FontType Structure
ParagraphStyle Structure
BoxStyle Structure
SharpLeaf Enumerations
DocumentLayout Classes
DocumentLayout Class
PageLayout Class
PageElement Abstract Class
Frame : PageElement Class
TextBlock : PageElement Class
ImageBlock : PageElement Class
Box : PageElement Class
Rule : PageElement Class
Common Reference
Document Class
VectorMath Class
DbUtil Class
Download
Release Notes
Licensing
Getting Started > Your first Chart
Your first Chart
Let’s build a simple chart that will get you started with the SharpPlot class for charting.
Here’s a samples chart that’s the nearest thing to a “Hello world” example for a SharpPlot script:
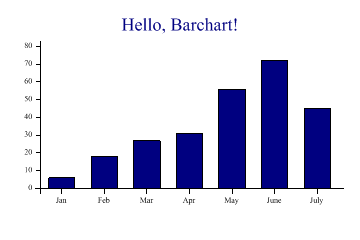
// Getting started with SharpPlot.

using System;
using System.Drawing;
using System.Drawing.Imaging;
using Causeway;

namespace SharpPlotSample
{
  class Example
  {
    static void Main(string[] args)
    {
      // A simple composite chart showing most key features
       SharpPlot sp = new SharpPlot(360,240);
       sp.Heading = "Hello, Barchart!";
       int[] data = new int[] {6,18,27,31,56,72,45};
       string[] xlabs = new string[]{"Jan","Feb","Mar","Apr","May","June","July"};
       sp.SetXLabels(xlabs);
       sp.DrawBarChart(data);

      // Render the chart as a 96dpi PNG image, and save to file
       sp.SaveImage("firstbar.png",ImageFormat.Png,96);
       Console.WriteLine("Saved as firstbar.png!");
    }
  }
}
This will create the chart at the top of the page as an image file on disk.
How it all works
A good way to begin to learn about SharpPlot is to copy and modify the source, changing some properties and adding some new ones to see the effect. The SharpPlot engine is a ‘state machine‘ – you can set any of its internal properties at any time, and they stay set until you reset them. The current state influences the appearance and style of all the drawing commands in a logical and predictable way, but everything has a good default value to begin with.
The commands in the sample program work like this:
- SharpPlot sp = new SharpPlot(360,240);
- This resets all properties to their default values and clears a ‘chart area’ covering 360 by 240 points. This is a little smaller than the default size, and is a comfortable shape for many standard business charts.
- sp.Heading = “Hello, Barchart!”;
- The main heading is centred in the top margin by default.
- sp.SetXLabels(xlabs);
- Labels are defined with one value per data-point
- sp.DrawBarChart(data);
- Now we can draw the chart!
- sp.SaveImage( ... );
- Render the completed chart to file at 96dpi.
So generally, a SharpPlot script iterates through three steps :
- Set up the drawing area
- Set up (or reset) chart parameters
- Draw chart
Then ends with the rendering of the whole chart to an image.
Spicing it up
You might guess that to change the default positioning of the heading, you could add a HeadingStyle property, and maybe you would like the abut the bars, so you could set the Gap property to zero. In general, SharpPlot is designed so that everything looks good when you take all the defaults, but if you have a specific design in mind, you can control the appearance of your chart very finely indeed. Here is the same chart with a few properties added, and some changes to styles and fonts to give you an idea of the possibilities:
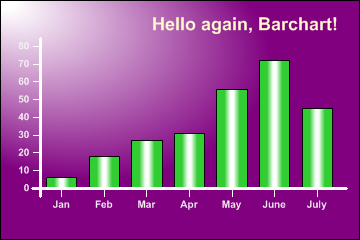
The body of the sourcecode now looks like this:
   // Do it again, but prettier?
    sp.Reset(360,240);
    sp.SetBackground(Color.Purple,FillStyle.SpotTopLeft,2);
    sp.SetAxisStyle(Color.White,LineStyle.Solid,2.5);
    sp.Heading = "Hello again, Barchart!";
    sp.SetHeadingFont("Arial",18,FontStyle.Bold,Color.LemonChiffon);
    sp.SetLabelFont("Arial",10,FontStyle.Bold,Color.WhiteSmoke);
    sp.SetColors(Color.LimeGreen);
    sp.SetFillStyles(FillStyle.Drum);
    sp.HeadingStyle = HeadingStyles.Right;
    sp.Gap = 0.4;
    sp.SetXLabels(xlabs);
    sp.DrawBarChart(data);
This adds several properties, the most important being the Background to change the paper colour from white to deep purple with a spotlight gradient. It also sets the axes to white (and a little heavier) and changes the typesizes and colours for the various text elements. The x and y captions have also been centred and the heading is aligned with the right margin.
In general, you should start with a minimal collection of properties, and a very simple script. This approach lets you focus on getting the data correct, while leaving almost all the properties set to their default values. Once you have the chart working, then you can let the designers loose to play with the colours, typefaces and layout, adding more properties as you need them.
See also ...
Getting Started | SharpPlot Tutorials | SharpPlot in different Languages