| Automated charting and reporting |
SharpPlot Tutorials
General Tutorials
Chart Samples
Style Examples
SharpLeaf Tutorials
Document Layout Tutorials
Text Flow Tutorials
Table Tutorials
Visual Glossaries
SharpPlot Reference
SharpPlot Class
SharpPlot Properties
SharpPlot Methods
SharpPlot Structures
SharpPlot Enumerations
PageMap Class
SharpLeaf Reference
SharpLeaf Class
SharpLeaf Properties
SharpLeaf Methods
Table Class
Table Properties
Table Methods
SharpLeaf Structures
FontType Structure
ParagraphStyle Structure
BoxStyle Structure
SharpLeaf Enumerations
DocumentLayout Classes
DocumentLayout Class
PageLayout Class
PageElement Abstract Class
Frame : PageElement Class
TextBlock : PageElement Class
ImageBlock : PageElement Class
Box : PageElement Class
Rule : PageElement Class
Common Reference
Document Class
VectorMath Class
DbUtil Class
Download
Release Notes
Licensing
Getting Started > SharpPlot in different Languages
SharpPlot in different Languages
SharpPlot being delivered both as a .Net assembly and as an APL workspace, it can be used in many different languages. This tutorial shows how to write the same SharpPlot script in different languages (C#, VB/.Net, Dyalog APL/.Net, Dyalog APL).
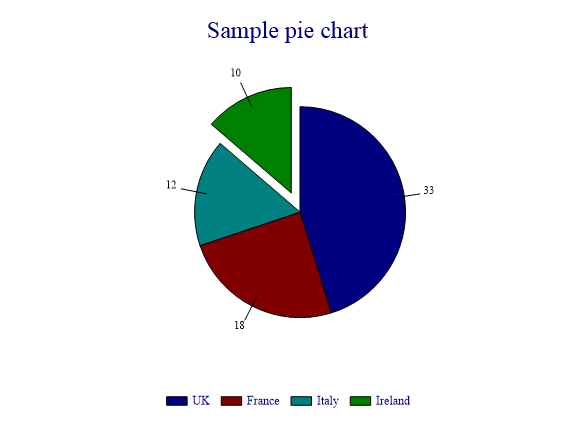
Sample chart in C#
Here’s the code to produce that chart from C#. It can be used as a Rosetta stone for users trying to write scripts in other languages.
To build this project in Visual Studio, a few steps are required :
- Create a Console C# project in Visual Studio
- Add a reference to System.Drawing (Project → Add Reference... → .Net)
- Add a reference to sharpplot.dll (Project → Add Reference... → Browse)
- Paste the following code into your main .cs file
- Build and run
 using System;
using System.Drawing;       // Requires adding a reference to System.Drawing to the C# project
using System.Drawing.Imaging;
using Causeway;             // Requires adding a reference to sharpplot.dll to the C# project

namespace MyNamespace
{
  class MyClass
  {
    static void Main(string[] args)
    {
        int[] data = {33, 18, 12, 10};
        int[] exp = {0, 0, 0, 20};
        string[] key = {"UK", "France", "Italy", "Ireland"};
        Color[] cols = {Color.Navy, Color.Maroon, Color.Teal, Color.Green};

        SharpPlot sp = new SharpPlot();                               // Use default size
        sp.Heading = "Sample pie chart";                              // Property
        sp.PieChartStyle = PieChartStyles.ValueTags;                  // Flag property with single flag
        sp.KeyStyle = KeyStyles.CenterAlign|KeyStyles.BottomAlign;    // Flag property with multiple flags
        sp.SetKeyText(key);                                           // Single-argument function
        sp.SetColors(cols); // Single-argument function
        sp.SetMargins(42, 48, 36, 18);                                // Multiple-argument function
        sp.DrawPieChart(data, exp);                                   // Multiple-argument function

        sp.SaveImage("samplepie.png", ImageFormat.Png);               // Save chart as PNG image at default size
        Console.WriteLine(sp.RenderSvg());                            // Output SVG image source to standard text stream
    }
  }
}
Sample chart in VB.Net
Here’s the same script in VB.Net. You can build it in a few steps :
- Create a Console VB.Net project in Visual Studio
- Add a reference to System.Drawing (Project → Add Reference... → .Net)
- Add a reference to sharpplot.dll (Project → Add Reference... → Browse)
- Paste the following code into your main .vb file
- Build and run
 Imports System
Imports System.Drawing   ' Requires adding a reference to System.Drawing to the VB.Net project
Imports System.Drawing.Imaging
Imports Causeway         ' Requires adding a reference to sharpplot.dll to the VB.Net project

Module Module1
    Sub Main()
        Dim data As Integer() = New Integer() {33, 18, 12, 10}
        Dim exp As Integer() = New Integer() {0, 0, 0, 20}
        Dim key As String() = New String() {"UK", "France", "Italy", "Ireland"}
        Dim cols As Color() = New Color() {Color.Navy, Color.Maroon, Color.Teal, Color.Green}

        Dim sp As SharpPlot = New SharpPlot                                     ' Use default size
        sp.Heading = "Sample pie chart"                                         ' Property
        sp.PieChartStyle = PieChartStyles.ValueTags                             ' Flag property with single flag
        sp.KeyStyle = KeyStyles.CenterAlign+KeyStyles.BottomAlign               ' Flag property with multiple flags
        sp.SetKeyText(key)                                                      ' Single-argument function
        sp.SetColors(cols)                                                      ' Single-argument function
        sp.SetMargins(42, 48, 36, 18)                                           ' Multiple-argument function
        sp.DrawPieChart(data, exp)                                              ' Multiple-argument function

        sp.SaveImage("samplepie.png", ImageFormat.Png)                          ' Save the chart as PNG image at default size
        Console.WriteLine(sp.RenderSvg())                                       ' Output SVG image source to standard text stream
    End Sub
End Module
Sample chart in Dyalog APL/.Net
Because Dyalog has a .Net bridge, it can use sharpplot.dll directly, which is in the default Dyalog installation directory, and can be accessed by setting ⎕USING to ‘,sharpplot.dll’.
Refer to the Dyalog .Net Interface Guide if you need explanations about how to use .Net objects and pass arrays as arguments.
 ∇ {svg}←MyChart;⎕USING;data;exp;key;sp
  ⎕USING←'System.Drawing,system.drawing.dll' 'System.Drawing.Imaging' 'Causeway,sharpplot.dll'
  data←33 18 12 10
  exp←0 0 0 20
  key←'UK' 'France' 'Italy' 'Ireland'

  sp←⎕NEW SharpPlot                                 ⍝ Default size
  sp.Heading←'Sample pie chart'                     ⍝ Property
  sp.PieChartStyle←PieChartStyles.ValueTags         ⍝ Flag property with single flag
  sp.KeyStyle←KeyStyles.(CenterAlign+BottomAlign)   ⍝ Flag property with multiple flags
  sp.SetKeyText(⊂key)                               ⍝ Need to enclose the key vector because it is a single argument, rather than a list of arguments
  sp.SetColors ⊂Color.(Navy Maroon Teal Green)      ⍝ Need to enclose the vector because it is a single argument
  sp.SetMargins(42 48 36 18)                        ⍝ No need to enclose because the 4-item vector maps to 4 arguments
  sp.DrawPieChart(data exp)                         ⍝ No need to enclose here because the 2-item vector maps to 2 different arguments

  sp.SaveImage('samplepie.png' ImageFormat.Png)     ⍝ Save the chart as a PNG image, at default size
  svg←sp.RenderSvg ⍬                                ⍝ Return SVG image source
∇
See the ]chartUser Command for more samples, and a GUI interface to build chart scripts.
Sample chart in non-.Net Dyalog APL
Since Dyalog v14.0, SharpPlot is also shipped as a pure-APL workspace, than can be used on all platforms supported by Dyalog. All you need to do is to copy sharpplot.dws.
The main difference from using SharpPlot through the .Net bridge is the lack of support for raster graphics. Charts can be output only as SVG, PostScript or PDF (VML is deprecated and should not be used).
Because of the number of different classes provided by the sharpplot workspace, you probably want to bring them in a parent namespace for charting.
⎕CS 'Causeway' ⎕NS '' ⋄⎕CY 'sharpplot' ⍝ copy all classes in a single namespace called "Causeway"
 ∇ {svg}←MyChart;data;exp;key;sp
  data←33 18 12 10
  exp←0 0 0 20
  key←'UK' 'France' 'Italy' 'Ireland'

  sp←⎕NEW SharpPlot                                 ⍝ default size
  sp.Heading←'Sample pie chart'                     ⍝ Property
  sp.PieChartStyle←PieChartStyles.ValueTags         ⍝ Flag property with single flag
  sp.KeyStyle←KeyStyles.(CenterAlign+BottomAlign)   ⍝ Flag property with multiple flags
  sp.SetKeyText(⊂key)                               ⍝ Need to enclose the key vector because it is a single argument, rather than a list of arguments
  sp.SetColors⊂Color.(Navy Maroon Teal Green)       ⍝ Need to enclose the vector because it is a single argument
  sp.SetMargins(42 48 36 18)                        ⍝ No need to enclose because the 4-item vector maps to 4 arguments
  sp.DrawPieChart(data exp)                         ⍝ No need to enclose here because the 2-item vector maps to 2 different arguments

  sp.SaveSvg(⊂'samplepie.svg')                      ⍝ SharpPlot/APL doesn't support raster graphics : SVG is the recommended way to export charts.
  svg←sp.RenderSvg ⍬
∇
See the #.Samples namespace in the sharpplot workspace for more example scripts.
Cross-platform charts in Dyalog APL
The best way to create cross-platform charts in Dyalog APL is to use the InitCauseway function. It will pick the .Net assembly if it’s available, else fall back to pure-APL SharpPlot.
It will initialise the argument namespace (current space if ⍬ is given), by creating a Causeway and a System.Drawing namespace there, so that code can be using interoperably on all platforms supported by Dyalog. The advantage over the previous strategies is that the namespace will be cluttered with fewer names (only Causeway, System and Drawing, rather than the whole list of structures used by Causeway).
However all structures will have to be fully qualified : structures from the Causeway assembly (all in this documentation) will have to be prepended with Causeway, and System.Drawing structures (Color, FontStyle) will have to be prepended with System.Drawing. That way the script will be completely cross-platform.
All you need to do to initialise the namespace once with:
    'InitCauseway' 'View' ⎕CY 'sharpplot'
    InitCauseway ⍬   ⍝ initialise current namespace
Then the same script as above is written as:
 ∇ {svg}←MyChart;data;exp;key;sp
    data←33 18 12 10
    exp←0 0 0 20
    key←'UK' 'France' 'Italy' 'Ireland'

    sp←⎕NEW Causeway.SharpPlot                        ⍝ default size
    sp.Heading←'Sample pie chart'                     ⍝ Property
    sp.PieChartStyle←Causeway.PieChartStyles.ValueTags         ⍝ Flag property with single flag
    sp.KeyStyle←Causeway.KeyStyles.(CenterAlign+BottomAlign)   ⍝ Flag property with multiple flags
    sp.SetKeyText(⊂key)                               ⍝ Need to enclose the key vector because it is a single argument, rather than a list of arguments
    sp.SetColors ⊂System.Drawing.Color.(Navy Maroon Teal Green)      ⍝ Need to enclose the vector because it is a single argument
    sp.SetMargins(42 48 36 18)                        ⍝ No need to enclose because the 4-item vector maps to 4 arguments
    sp.DrawPieChart(data exp)                         ⍝ Two arguments

    sp.SaveSvg(⊂'samplepie.svg')                      ⍝ SharpPlot/APL doesn't support raster graphics : SVG is the recommended way to export charts.
    svg←sp.RenderSvg ⍬                                ⍝ Return SVG image source
∇
See also ...
Getting Started | SharpPlot Tutorials | SharpLeaf Tutorials | Installing SharpPlot | SharpPlot Members