| Automated charting and reporting |
Chart Samples
Style Examples
SharpLeaf Tutorials
Document Layout Tutorials
Text Flow Tutorials
Table Tutorials
Visual Glossaries
SharpPlot Reference
SharpPlot Class
SharpPlot Properties
SharpPlot Methods
SharpPlot Structures
SharpPlot Enumerations
PageMap Class
SharpLeaf Reference
SharpLeaf Class
SharpLeaf Properties
SharpLeaf Methods
Table Class
Table Properties
Table Methods
SharpLeaf Structures
FontType Structure
ParagraphStyle Structure
BoxStyle Structure
SharpLeaf Enumerations
DocumentLayout Classes
DocumentLayout Class
PageLayout Class
PageElement Abstract Class
Frame : PageElement Class
TextBlock : PageElement Class
ImageBlock : PageElement Class
Box : PageElement Class
Rule : PageElement Class
Common Reference
Document Class
VectorMath Class
DbUtil Class
Download
Release Notes
Licensing
SharpPlot Tutorials > General Tutorials > Active charts in GUI Applications
Active charts in GUI Applications
The PageMap class allows the programmer to explore hotspot data contained in any chart, so that the application can interact with chart items and data.
Creating Active Charts
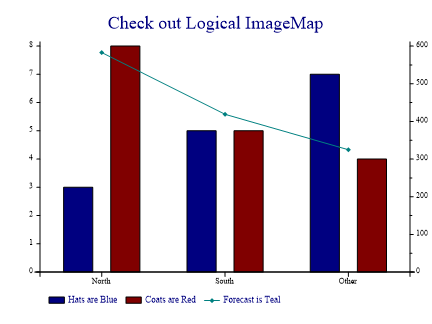
sp = new SharpPlot();

sp.SetChartName("Bar1");
sp.SetSeriesNames(new string[]{"Hats","Coats"});
sp.Heading = "Check out Logical ImageMap";

sp.AddTips(ScriptTarget.Heading,"This is the heading, honest!");
sp.AddTips(new string[]{"Hat 3","Hat 5","Hat 7"},"Hats");  // First series
sp.AddTips(new string[]{"Coat 8","Coat 5","Coat 4"},"Coats");  // Second series
sp.AddHints("Click me");  // default hint for all series items

sp.SetXLabels(new string[]{"North","South","Other"});  // Should show up with a counter
sp.XTrackFormat = "Region-#0";  // Logical x-axis
sp.YAxisStyle = YAxisStyles.ForceZero;
sp.YTrackFormat = "#0.0kg";  // Formatter for primary y-scale

sp.DrawBarChart(new int[][]{new int[]{3,5,7},new int[]{8,5,4}});

sp.NewYAxis();
sp.SetMarkers(Marker.Lozenge);
sp.YAxisStyle = YAxisStyles.ForceZero|YAxisStyles.RightAxis;
sp.LineGraphStyle = LineGraphStyles.Markers;
sp.SetYTickMarks(100,1);

tips = new string[]{"Guess 583","Guess 419","Guess 325"};
sp.AddTips(tips);  // Default series
sp.DrawLineGraph(new int[] {583,419,325});

sp.SetKeyText(new string[]{"Hats are Blue","Coats are Red","Forecast is Teal"});
It is relatively easy to make simple interactive graphics on the internet, using a combination of JavaScript (attached to data series) and the SharpPlot Addxxx methods to associate Hints, Tips, Actions and Hyperlinks with elements of a data series. Typically you could allow a user to ‘drill down’ on summary data by clicking on the bars of a barchart, and linking to a detailed display of the underlying figures. The chart below is used for all the worked examples in this section.
The methods in this class allow an application to implement similar capabilities, by converting raw co-ordinates into hotspot information, and using this to extract the hints, tips and links associated with the data. An obvious application would be to show any hints in a status field as the mouse passes over the corresponding items of the data series.
Example
pm = sp.RenderPageMap();
System.Console.WriteLine("Pagemap has "+pm.ToString());
hix = pm.FindHotspot(200,120);  // Middle bar
hi = pm.GetHotspotInfo(hix);  // Full details so we can see it
System.Console.WriteLine("Series detail is "+hi.ToString());
tip = pm.FindTip(hix);
System.Console.WriteLine("Tip for this element is "+tip);
All co-ordinates are required as (x,y) in points, with the origin at the lower-left corner of the chart. If your application allows the user to resize the form containing the chart, you will need to scale any mouse-move values back to match the paper-size that SharpPlot was called with when the chart was created. The output from the sample is:
Pagemap has Series/targets=16, Hints=2, Tips=10, Links=0, Scripts=0
Series detail is Chart=Bar1, Series=Hats, Item=2, Shape=Bar, Locator=186.9 52 216 193.3 0 0
Tip for this element is Hat 5
The locator is stored to full precision, but is rounded off to the nearest 10th pt for display here.
See also ...
SharpPlot.RenderPageMap Method | HotspotInfo Struct | HotspotType Enumeration | PageMap.PageMap Members