| Automated charting and reporting |
SharpPlot Tutorials
General Tutorials
Chart Samples
Style Examples
SharpLeaf Tutorials
Document Layout Tutorials
Text Flow Tutorials
Table Tutorials
Visual Glossaries
SharpPlot Class
SharpPlot Properties
SharpPlot Structures
SharpPlot Enumerations
PageMap Class
SharpLeaf Reference
SharpLeaf Class
SharpLeaf Properties
SharpLeaf Methods
Table Class
Table Properties
Table Methods
SharpLeaf Structures
FontType Structure
ParagraphStyle Structure
BoxStyle Structure
SharpLeaf Enumerations
DocumentLayout Classes
DocumentLayout Class
PageLayout Class
PageElement Abstract Class
Frame : PageElement Class
TextBlock : PageElement Class
ImageBlock : PageElement Class
Box : PageElement Class
Rule : PageElement Class
Common Reference
Document Class
VectorMath Class
DbUtil Class
Download
Release Notes
Licensing
SharpPlot Reference > SharpPlot Methods > DrawLineGraph Method
SharpPlot.DrawLineGraph Method
Constructs a linegraph or surface plot from an array of data values. This chart is typically used to show timeseries data, but may also be used with an explicit set of X-values to draw any mathematical curve.
Example
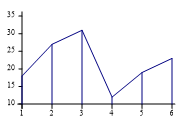
sp = new SharpPlot(180,120);
sp.SetMargins(12,12,18,4);
sp.LineGraphStyle = LineGraphStyles.Risers;
data = new int[] {18,27,31,12,19,23};
sp.DrawLineGraph(data);
The short tutorial shows a few of the possibilities and some sample code.
Overloads
- public void DrawLineGraph(int[] data);
- public void DrawLineGraph(double[] data);
- public void DrawLineGraph(int[][] data);
- public void DrawLineGraph(double[][] data);
- public void DrawLineGraph(int[] data,int[] xValues);
- public void DrawLineGraph(double[] data,int[] xValues);
- public void DrawLineGraph(int[] data,double[] xValues);
- public void DrawLineGraph(double[] data,double[] xValues);
- public void DrawLineGraph(int[][] data,int[] xValues);
- public void DrawLineGraph(double[][] data,int[] xValues);
- public void DrawLineGraph(int[][] data,double[] xValues);
- public void DrawLineGraph(double[][] data,double[] xValues);
Description
Linegraphs are most commonly used to represent data which changes over time (stock prices or currency values are typical) but may be used wherever pairs of X and Y values are joined by lines. The default is to join the points with straight lines, but for some applications (for example illustrating a graph of Y-squared versus X) then it is better to use smooth curves.
This chart has a wide variety of styles, for example it can draw risers from the X-axis, fill the surface, add arrowheads to the end of each line, and so on. These styles can be combined as required by calling DrawLineGraph several times with different style settings to overlay multiple charts on the same set of axes.
See also ...
Line graphs and Time series | SharpPlot Members | SharpPlot.LineGraphStyle Property